Journal of Crystal Growth 125
(1992) 215-222
North-Holland
Ó1992 – Elsevier
Science Publishers B.V. All rights
reserved
Calcium oxalate monohydrate crystallization: citrate inhibition of nucleation and growth steps
Peter
A. Antinozzi, Charles M. Brown and Daniel L. Punch
Center for the Study of
Urolithiasis and Pathological Calcification and Department of Biochemistry and
Molecular Biology, University of Florida College of Medicine, Gainesville,
Florida 32610-0247, USA
Received 30 March 1992;
manuscript received in final form 29 June 1992
The inhibitory action of citrate on calcium oxalate monohydrate (COM)
crystallization has been examined in terms of nucleation and crystal growth
kinetic properties. Lag-time data for the appearance of crystals and [‘4C]
oxalate incorporation under crystal growth conditions allowed us to investigate
the influence of citrate at physiological levels (3.5mM). Moreover, through the
use of the EQUIL software, we formulated our solutions based on calculations of
solute composition such that free calcium concentrations were the same in the
absence and presence of this tricarboxylic acid. The presence of citrate had
little effect on the apparent interfacial free energy as determined by
nucleation kinetic studies, but total particle production was greater in the
absence of citrate; this was evident from electron microscopy and was also
indicated by corresponding values of pre-exponential terms of the Gibbs—Thomson
equation. Crystal growth rates were lowered in the presence of citrate to 30%
of the uninhibited value, and distinctive morphological habit modifications
were also observed by scanning electron microscopy. Together, these findings
suggest that citrate may influence COM crystallization at several stages, and
we present a model for face-specific growth inhibition by citrate acting on the
(010) COM crystal face.
1. Introduction
Understanding the factors that influence the course of calcium oxalate
monohydrate (COM) crystallization promises to provide insight about processes
thought important in urolithiasis. In particular, much attention has been
devoted to the analysis of crystallization in terms of discretely defined
physical chemical processes (i.e., nucleation, crystal growth, aggregation, and
breakup) although such processes may be overlapping in a temporal sense.
Nonetheless, such a physicochemical treatment may afford a means of
understanding the action of agents that promote or inhibit COM crystallization.
Brown et al. [1] recently described several approaches for distinguishing
between crystal growth and nucleation effects, and they attempted to
distinguish between the interfacial free energy term and the “nucleation
efficiency” term that are related to the lag-time for crystallization by use of
the
Gibbs—Thomson
equation. We were motivated by the success of that experimental approach to investigate
the action of citrate as an inhibitor of COM crystallization. About half a
century ago, Greenwald [2] first recognized the complexation of calcium ion by
various organic acids, among them citrate, and he discussed the physiological
significance of the sharp increase in the solubility of salts such as calcium
sulfate, calcium carbonate and calcium phosphate as brought about by malic and
fumaric acids. Kissen and Locks [3] established that the urinary citrate levels
of patients suffering from urolithiasis were reduced compared with control
subjects, and many other investigators have labored to characterize the basis
for such a difference and/or its impact on crystallization. The implication
that citric acid is a factor in urolithiasis promoted efforts both to
understand its ability to dissolve kidney stones and its role in their
formation. In 1961, Light and Zinsser [4] examined the rate of formation of
calcium oxalate in the presence of various substances found in urine,
including citrate, and in fact, they studied nucleation rates by observing
lag-times. Subsequent studies of the inhibitory action of citrate focused on
determinations of crystal growth viewed in its broadest sense (i.e., there are
many steps in the formation of a solid phase from an aqueous solution, and a
substance influencing any of these steps may be called an inhibitor). For
example, complexation reduces the driving force for crystal growth, and this
effect must be distinguished from those that influence incorporation of lattice
ions into the crystal. Even some recent crystal growth studies have overlooked
this distinction [5] and
experimental results represent a convolution of metal-ligand complexation and
true growth inhibitory effects.
In this work, we applied nucleation kinetic [1] and crystal growth rate
experiments to analyze the action of citrate on COM nucleation and crystal
growth. We used the EQUIL speciation software [6] to achieve desired relative
supersaturations (RS) with respect to calcium oxalate monohydrate (COM) while
keeping the RS in control solutions and citrate-containing solutions unchanged.
Moreover, to minimize changes in the [Ca2+]free/[OX>]tree
ratio, we maintained constant free ionic calcium, [Ca2+ ]free and free ionic
oxalate, [OX2~]free, concentrations for the
control and experimental solutions of corresponding RS values, achieving a
virtually constant ratio for all solutions. This ratio also controls surface
charging and the zeta potential of the COM surface [7,8], and may therefore
influence crystal growth.
2. Materials and
methods
Solution
preparation. Reagent grade chemicals were used without further
purification, and water of 10 M12 conductivity was produced with a MilliQ high
purity water system. All solutions were filtered through 0.22 ~tm Millipore GS
filters (4.7 cm diameter) and cation concentrations were determined with a
Perkin-Elmer atomic absorption spectrophotometer. Calcium and oxalate concentrations
were adjusted to achieve desired relative
supersaturation
(RS) values, with RS defined as the calcium-oxalate ion activity product
divided by its equilibrium value. At each RS, two reactant solutions were
prepared, one containing potassium oxalate and the other calcium chloride dihydrate.
Typically, the buffered solution consisted of 0.1M sodium chloride, 0.O1M
HEPES, and determined levels of either potassium oxalate or calcium chloride
dihydrate. The solutions were maintained at 370C and pH was adjusted
to 6.5. The
total calcium and oxalate levels in each were chosen using EQUIL to ensure that
uncomplexed Ca2~ was the same for samples with and without citrate.
The second constraint in the EQUIL computations was to maintain the relative
super-saturations of each pair of samples (i.e., with and without citrate).
Calculated concentrations of free ionic and complex species for calcium oxalate
monohydrate solutions in the presence and absence (values in parentheses) of
citrate at a relative supersaturation of 19.7 (pH 6.5): total citrate, 3.5mM (none);
sodium ion, 99.8mM (99.8mM); potassium ion, 1.60mM (1.88mM); calcium ion,
0.73mM (0.72mM); chloride, 106mM (102mM); oxalate, 0.51mM (0.49mM); citrate,
1.17mM (none); HEPES (unprotonated), 1.34mM (1.33 mM); HEPES (protonated),
8.66mM (8.67mM); potassium chloride, 19.8mM (22.7mM); monohydrogen
oxalate ion, 1.51~tM (1.48~tM); monosodium oxalate ion, 1751LM (230j.tM);
mono-potassium oxalate ion, 0.044mM (0.052mM); calcium
oxalate, 121mM (121mM); dicalcium
oxalate ion, 6.27mM (6.18mM); calcium
dioxalate ion, 1.06mM (1.02mM); calcium
hydrogen oxalate ion, 0.021mM (0.021mM);
monohydrogen citrate, 0.28mM (none); dihydnogen citrate, 2.O5btM (none);
monopotassium citrate, 6.65mM (none); calcium citrate
anion, 2.02mM (none); calcium hydnogen cjtrate, 16.6mM (none). Between citrate-containing
and control solutions, uncomplexed Ca2 + levels agreed within 1%, and
uncomplexed Ox2 - within 4%; correspondingly,
surface charge effects on COM due to variation in [Ca2 + ]tree were minimized.
Nucleation. A typical run
began by rapidly mixing 2.5 mL each of the two
reactant solutions by manually pushing the fluids through an in-line helical
mixer into a 1 cm pathlength polystyrene
Fig. 1. Typical
turbidity plot used for lag time measurements. RS 37 with 3.5mM citrate. r =
100 s.
cuvette.
We chose polystyrene because glass, quartz, and acrylic cuvettes produced
appreciable growth on their surfaces. Turbidity was measured for 10 mm using a
Perkin-Elmer 559A UV/VIS spectrometer in absorbance mode at 530 nm. Lag-times,
r, were determined from plots of absorbance versus time (fig. 1). The selected
RS range was based on the behavior of turbidity measurements with respect to
increasing RS. Below RS 20, the turbidity increase did not exceed 0.05 absorbance
units, and lag-times resulting from small deviations above the baseline were
considerably less certain. Above RS 37, lag-times were under 30 s. A typical
experimental run is shown in fig. 1 where the dashed line indicates how the
lag-time was evaluated by extrapolating to a turbidity value of zero; for
example, in the case of citrate-containing systems at RS 19.7, the lag-time was
86 + 17 s. This method gave reproducible
estimates of the apparent nucleation lag-time. Therefore, we examined the
dependence of r on changes in the initial relative supersaturation of calcium
oxalate. Apparent interfacial free energy, s, was evaluated by plotting
ln(1/r) versus (ln RS)2 at six different relative supersaturation
values to produce a linear plot (fig. 2); s was obtained from the slope of the line as defined by the
Gibbs-Thomson equation [9]:
J=A exp[(-16ps3v2)/(3k3T3m2[ln(RS)]2)], (1)
where
J is
the nucleation rate which is proportional to 1/t (s-1), A the
pre-exponential factor, s the apparent interfacial
surface energy (erg cm-2, v the molecular volume (for
COM, 1.10 x 10⁻²² cm3), k the Boltzmann constant
(1.38 x 10⁻¹⁶ erg K-1), T the
absolute temperature (in these experiments, 310 K), m the number of growth units
represented by v, and RS the relative supersaturation.
Crystal growth. COM seeds were
produced using the dimethyl oxalate method [10]. First, a 2.5mM calcium
chloride solution was prepared, and the pH adjusted to 4.7 with dilute ammonium
hydroxide. Calcium chloride solution (150 mL) was added to 100 mL of ammonium
acetate— acetic acid buffer (2.5 M with respect to each) into a 500 mL
polymethylpentene plastic flask; then dimethyl oxalate (10 g) was added. The
flask was tightly closed and heated in an oven at 900C for 2.5 h,
followed by rapid cooling to room temperature. Crystals were collected by
centrifugation, washed with a RS 1 solution in NaCl— HEPES buffer, and diluted
to 0.311 mg mL-1. Crystals produced were monoclinic, with an average
length of 3.5 mm (fig. 4c).
The advantage of this method is that a substantial quantity of large
morphologicaily well described crystals were produced by slowly generating
oxalate in situ under zero-order kinetic conditions. Surface area of 1700 cm2
g-1 was determined using the BET surface area analysis (Porous
Materials, Inc.).
Equal volumes of calcium and oxalate reactant solutions were added to a
50 mL polymethylpentene flask maintained at 370C in a water bath (14C-oxalate
was added as tracer to oxalate solutions). COM seed slurry (0.062 mg mLt final
concentration) was added to initiate crystallization. At 5 mm intervals,
aliquots were removed and filtered through a 0.22 ~.tm Nucleopore filter (25
mm). The filtrate was dispensed into a scintillation vial with 100 ~.tL normal
HCI and scintillation cocktail (Scintiverse II). Samples were counted using a
Beckman LS 3801 liquid scintillation counter. The crystal-laden filters were
also counted after rinses with 3 mL of RS 1 solution. Oxalate concentrations
were determined, and RS values were calculated assuming a 1 : 1 calcium oxalate
precipitate. We should note that under these conditions [‘4C]
oxalate exchange with seeds should be negligible. To estimate the influence of
citrate on the crystal growth rate of calcium oxalate monohydrate, we used the
parabolic growth rate law: (-d RS/dt = kst[RSi - RS¥2). Integrating
this equation gives
kstt = (RSt - RS¥)-1
- (RSt - RS¥)-1,
where
t is the time interval from the beginning of crystallization (in
seconds), RS~ the relative supersaturation at time t, RSi the
initial relative supersaturation, RS¥. the relative
supersaturation at equilibrium (defined as 1), K the crystal growth rate
constant (s-1), and st the total crystal surface
area at time t. We calculated st
by matching fractional changes in total seed mass as determined from the
growth experiments to fractional changes in volume and correlated these to fractional
changes in surface area using the surface area of the seeds (1700 cm2 g1)
as s0. Volume and surface were related to each other based on the
geometry of hexagonal prisms closely similar in morphology and dimension to the
actual seeds as observed by SEM.
Morphology.
Samples for microscopic analysis were taken at specified intervals
after beginning
the
experiment; typically, a 0.5 mL aliquot was removed and filtered through a 0.22
mm Nucleopore
filter (13 mm). In the nucleation experiments, crystals were fixed after five
and ten mm for each of the twelve solutions. For the crystal growth
experiments, crystals were filtered after 0, 3, and 24 h for RS 20 solutions
with and without citrate. Crystals were then gold-coated and examined by
scanning electron microscopy. Surface analysis was performed using a KEVEX
X-ray spectrometer; no surface contaminants were found.
Particle
characterization. Experimental systems the same as those used for
lag-phase measurements were employed for purposes of particle
characterization. Aliquots of these solutions were taken 20 mm after mixing
[11]. Total particle number and mode particle diameter (equivalent spherical
diameter) were measured using an Elzone 80 XY (Particle Data, Inc.).
3. Results
To understand the action of
citrate, we first applied a lag-phase kinetic analysis in which the appearance
of crystals was evaluated turbidimetrically using a spectrophotometer at a
non-absorbing wavelength (530 nm). When data collected in these experiments
were analyzed using the Gibbs-Thomson equation as discussed above, plots of
ln(1/r) versus (ln RS)-2 gave slopes of -62.5 + 1.92 for control
and -49.5 + 6.26 for the
experiment with citrate; intercepts were 1.03 + 0.2 and —0.72 ±
0.6 respectively. The slopes were further analyzed by converting them into
values for the apparent interfacial energy for nucleation. This was done by
solving the equation
slope = (—16ps3v2/3k3T3), (2)
taken
from the linearized form of the Gibbs-Thomson equation (cf. eq. (1)). Apparent
interfacial energy for the control was 28.9 erg cm2, and for the
citrate system it was 26.8 erg cm2. These values may be compared
with those derived for systems very similar to our control system. In earlier
work [1], we found a value of 27.3 erg
Fig. 2. Gibbs—Thomson nucleation plot: (●) control slope = -63±6.3,
intercept = 1.0±0.60, r2 = 0.96; (▲) 3.5mM citrate slope = -50± 1.9,
intercept=0.71±0.18, r2 = 0.99.
cm2and Finlayson
[11] gave the value 31.1 erg-2 cm.
As another way of looking at nucleation, we examined particle
production in our nucleating systems. Based on the observations of Finlayson
[11], we expected total particles, N, to be a rather flat and somewhat noisy
function of relative supersaturation in this range of RS. This proved to be
the case, however, we did detect statistically significant differences in N and
in equivalent spherical diameter between the control and citrate systems.
Without citrate, the nucleating systems produced an average of 3.46 (± 1.94) x
iO~ particles per liter, with an average mode diameter of 12.4 + 3.8 ~tm. With
citrate, N
was 7.14 (± 2.78) x i0~ particles per liter, with an average mode
diameter of 8.2 ± 1.3 ~.tm.
Although there was a relatively small but significant difference between the apparent interfacial energies of the control and experimental systems, there was a considerable difference between the lag-times in the two sets of solutions at corresponding relative supersaturations. Table 1 shows that lag-times in citrate systems were invariably longer than the control systems by an average of 75%. We believed that the interfacial energies were an accurate reflection of nucleation in our experiments, and that the discrepancy in lag-times could be explained by growth inhibition due to the presence of citrate.
Crystal growth studies did indeed show a significant difference in
growth rates at a citrate
Table 1
Kinetics of
calcium oxalate monohydrate nucleation in the
absence and
presence of 3.5mM citratea)
Relative Observed lag times (s)
supersaturation Control 3.5mM citrate
20 400±44 560±26
22 250±14 350±80
24 170+66 290±47
28 130±57 170±61
33 70±19 140±33
37 30±12 90±17
a)Note that the
uncomplexed calcium ion concentrations for each pair of control and citrate
samples were the same, based on calculations with EQUIL.
Fig. 3. Determination of crystal growth rates: (e) control, K = 4.7±0.33X iO~ cm2
~ intercept = 0.093+0 052 r2 =
0.98, N=
7; (A) 3.5mM citrate K= 11+0
10x105 cm2 ~, intercept = 0.068±0.018, r2 = 0.96, N= 7.
concentration
of 3.5mM (see fig. 3). Again, we sought to control the solution very closely so
that differences in crystal growth rates could be clearly attributed to
citrate. The surface normalized crystal growth rate in the control was 2.36 (±
0.16) x 106 51 cm2,
whereas for the citrate system it was 0.66 (±0.03) x 106 51 cm2.
The reduced growth rate of COM in the presence of citrate allowed us to explain
the differences in particle counts and sizes we had observed. It was clear that
growth inhibition would cause smaller particles as we had seen with citrate,
but because growth was delayed, the relative supersaturation, and therefore the
nucleation rate, did not fall as quickly, consequently, more particles were produced.
Taken by itself, the doubling of the lag-times with citrate might have been
interpreted as inhibition of nucleation while the doubling of the particle
counts might have been interpreted as promotion of nucleation. By bringing
several techniques to bear on this closely controlled experimental design, a
self-consistent view of the action of citrate emerged which explained these
apparently conflicting results.
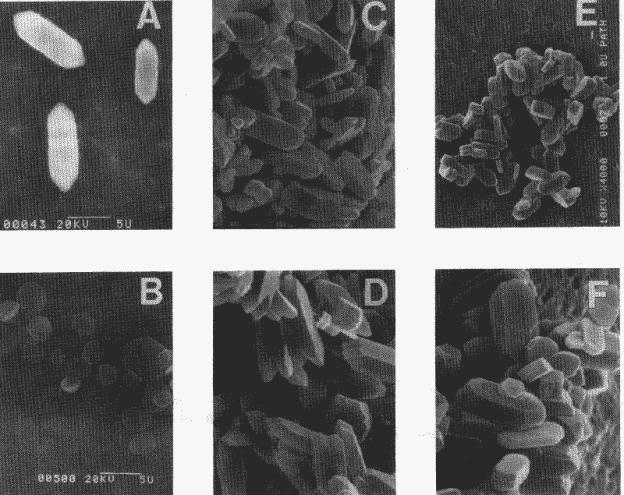
Fig. 4. Photographs
of COM using scanning electron microscopy. Nucleation experiments at 10
mm: (a) RS 20 control; (b) RS 20 with 3.5mM citrate. Crystal growth
experiments: (c) COM seeds at time zero; (d) COM seeds grown for 3 h in RS 20
control solution; (e) COM seeds grown for 3 h in an RS 20 containing 3.5mM
citrate solution (magnification: 4000 x); (f) COM seeds
grown
for 3 h in RS 20 containing 3.5mM citrate solution (magnification: 7800 x).
As
in our previous report on nucleation, we attempted to model these results with
our crystallization simulation program, PSD [1,12]. These efforts are still in
the preliminary stages, but early results are encouraging because the
simulations do reflect the general trends of the experiments.
The effect of citrate was seen in a striking way in electron
micrographs of crystals from the nucleating systems. Fig. 4a shows crystals of
COM nucleated in the control system. These crystals had a characteristic
morphology for COM; they were twinned (as in fig. 4c) and had a prominent
elongated hexagonal face. In the presence of citrate, however, the crystals
were broader and flatter with an aspect similar to regular hexagons (fig. 4b).
Seed crystals used in seeded growth experiments (fig. 4c) were not altered much
in shape by either control systems (fig. 4d) or systems containing citrate
(figs. 4e and 4f).
4. Discussion
In evaluating the inhibitory
action of citrate, we found that compensation for the complexation of cations
made a very considerable difference in the observed nucleation and growth rate
behavior. To achieve equal uncomplexed calcium ion concentrations in the
absence and presence of citrate, the total calcium concentration had to be
raised significantly. In the control samples, uncomplexed calcium ion
corresponded to about 85% of the total calcium ion concentration, whereas it
was only 25% of total calcium in the presence of citrate. Failure to account
for the importance of complexation would have resulted
Fig. 5. Computer simulation of COM crystal growth. (a) Morphology
of control crystal as predicted by maturing each crystal face. Initial
“nucleus” has an identical morphology. (b) Morphology of crystal computer grown
in a 3.5mM citrate solution by restricting growth on (010) face. See fig. 4b.
in
misleading inferences about apparent differences in the kinetics of nucleation
and crystal growth. By using EQUIL, however, we could correct for these
chelation effects by citrate, and our data show that the presence of calcium
citrate complex and citrate ions resulted in about a 70% decrease in crystal
growth rate. This observation indicates that uncomplexed citrate and/or
calcium citrate must reduce the efficiency of adding calcium ion, oxalate ion,
on calcium oxalate complex to crystal growth sites.
From our kinetic and morphological studies of calcium oxalate
monohydrate crystals, we now propose that citrate adsorbs preferentially to one
crystal face, thereby altering the morphology of the crystals during the
further accretion of calcium oxalate into the crystal. As shown in fig. 5, we
could start with a common initial crystal morphology and allow crystals to
“grow” using a computer program that represented changes in crystal mass as a
change in total volume of the geometrically defined crystal. Without any change
in apparent rates of addition to the various crystal faces, morphology was
maintained; however, by restricting growth on the (010) face, increased
addition to the other faces resulted in hexagonal plates shown in this figure.
Using the X-ray crystallographic data of Deganello and Piro [13] we developed
a specific proposal regarding this binding behavior. Of the three major planes
defining the calcium oxalate monohydrate crystal (i.e., the (010), (101), and
the (001) planes), only the first
two
have oxalate groups parallel to the face, and citrate would most probably
replace oxalate ion by binding on the (101) face.
In any case, the morphological changes due to the adsorption of citrate may be
significant in urolithiasis, because crystal—cell interactions and crystal
aggregation processes are both likely to be influenced by changes in crystal
morphology. For example, Wiessner et al. [14] reported that COM crystals
exhibit a much higher capacity to cause red blood cell membranolysis than do
dihydrate crystals. Likewise, the adhesion of COM crystals to papillary cells
are likely to be affected by the contour and nature of the various faces of
calcium oxalate crystals. Crystal aggregation may also depend upon morphology,
and the hexagonal plates formed in the presence of citrate may aggregate more
readily. All of these considerations have led us to initiate a longer term
study using stereo-chemical considerations as the basis for molecular
recognition at crystal interfaces [15]. Such efforts have already provided many
valuable inferences regarding changes in crystal morphology arising from
face-specific interactions of crystals and growth inhibitors [16,17]. While
clearly beyond the scope of our present work on citrate, we are attracted by
the potential of the molecular recognition approach which may reveal how
low-molecular-weight inhibitors such as citrate and pyrophosphate, as well as
macromolecules (e.g., nephrocalcin and Tamm—Horsfall proteins) affect crystal
growth processes.
Finally, although nucleation and growth processes in the case of
calcium oxalate monohydrate appear to overlap during the initial lag-phase of
precipitation, our earlier studies [1] as well as those of Söhnel and Mullin
[18] indicate that such lag-phase kinetics can be treated phenomenologically
in terms of the Gibbs—Thomson formulation. Nevertheless, as we probe further
into the details of the early steps in COM crystallization using the tools of
molecular recognition theory to establish a structural perspective, we
recognize that more advanced theoretical treatments of precipitation could be
helpful. Such models might, for example, allow for the deconvolution of the
overlapping time domains of nucleation and growth steps.
References
[1] C.M. Brown, D.K. Ackermann,
D.L. Punch and B. Finlayson, J. Crystal Growth 108 (1991) 445.
[2] I. Greenwald, J. Biol.
Chem. 124 (1938) 437.
[3] B. Kissen and MO. Locks,
Soc. Expt. Biol. Med. Proc. 46 (1941) 216.
[4] IS. Light and H.H. Zinsser,
Arch. Biochem. Biophys. 92 (1961) 487.
[5] H. Sidhu, R. Gupta, S. Thind
and R. Nath, Urol. Res. 14 (1986) 299.
[6] P. Werness, C. Brown, L.
Smith and B. Finlayson, J. Urol. 134 (1985) 1242.
[7] P. Curreri, G.Y. Onoda and
B. Finlayson, J. Colloid Interface Sci. 69 (1978) 170.
[8] J.H. Adair, Coagulation of
Calcium Oxalate Monohydrate Suspensions, PhD Dissertation, University of
Florida, Gainesville, FL (1981).
[9] AG. Walton, The Formation
and Properties of Precipitates (Kreiger, Huntington, NY, 1979) pp. 3—7.
[10] L. Gordon, M.L. Salutsky
and H.H. Willard, Precipita
tion from Homogeneous Solution (Wiley, New York, 1959) pp. 57—58.
[11] B. Fiolayson, Kidney
Intern. 13 (1978) 344.
[12] B. Finlayson, Comment on
the round table discussion on theoretical models related to urolithiasis, in:
Urolithiasis and Related Clinical Research, Eds. P.O. Schwille, L.H. Smith,
W.G. Robertson and W. Vahlensieck (Plenum, New York, 1985) pp. 923—933.
[13] S. Deganello and O.E.
Piro, Neues Jahrb. Mineral. Monatsh. H 2 (1981) 81.
[14] J.H. Wiessner, G.S.
Mandel and N.S. Mandel, J. Urol. 135 (1986) 835.
[15] I. Weissbuch, L. Addadi,
M. Lahav and L. Leiserowitz, Science 253 (1991) 637.
[16] J.D. Foot and E.A:
Colbourn, J. Mol. Graphics 6 (1988) 93.
[17] I. Weissbuch, L. Addadi,
L. Leiserowitz and M. Lahav, J. Am. Chem. Soc. 110 (1988) 561.
[18] 0. Sdhnel and J. Mullin, J. Colloid Interface Sci. 123 (1988) 43.